

Clusters and chromosomes
Almost two months on from first looking at DNA results, it can look like delving deeper has not come up with much. But there are some intriguing results, and it is interesting to see what the new tools and processes can come up with.
Widening the net
Several of the DNA testing companies allow you to upload an Ancestry DNA autosomal data file, which will provide matches against their own database of testers for free. However, the full features on their website’s require a small fee to be unlocked {1}. First, of course, download the file from Ancestry – then in this case straight away loading it to MyHeritage and GEDmatch (providing a variety of tools, not tests). A few weeks later, to FamilyTreeDNA as well, while waiting for their Y-DNA test results to arrive {2}.
For Ancestry, the top matches (with highest amounts of shared DNA or longest matched segments) proved to be a mixture of already known cousins and a similar number of others who were quite easy to fit to the existing tree {3}.
MyHeritage gave lower overall matches (about 14,000 against Ancestry’s 20,000) and lower still in terms of “close” relatives (a crude list comparison showed 8 against 23), but had some new names from younger generations. FamilyTreeDNA is significantly smaller, at about 4,000 total matches, with no close relatives spotted.
A few other people had clearly already uploaded their Ancestry tests across these other systems too, popping up as matches on one or both. Their names quickly became familiar, as they also tended to feature in the ‘cluster puzzles’ described below.
See note {4} for some statistics on DNA matching ‘strength’ across the databases.
Puzzling clustering
The most intriguing finding of the autosomal testing so far are a number of clusters of matches. The sites make it quite easy to identify other testers with ‘Shared’ or ‘Common’ matches to yourself. With this, and using the coloured labelling provided by both Ancestry and MyHeritage, groups can be created to filter results.
After accounting for those connected with known surnames from the family tree, several ‘mystery’ groupings remain. This is where you might hope to find the father of an ‘illegitimate’ ancestor hiding, or a distant ancestor with a common Welsh surname for instance, too difficult to trace in the written records available online. Uncovering their details isn’t likely to be straightforward, though.
Two clusters leapt out on Ancestry and can also be seen on MyHeritage and to a lesser extent FamilyTreeDNA.
In Somerset
One cluster has a common ancestral home (on one or more lines) to Seavington St Mary in Somerset, raising hopes that great great grandfather Walter Scott’s unknown father could be the missing link. But more striking was that the group matches nearly all also had an Elizabeth Phelps (sometimes given as Philips) born Seavington around 1805 – who then went on to marry one of three different men in Seavington, in 1825, 1826 or 1828. These Elizabeths clearly all went on to have families so it is not one person re-marrying. How can you be sure to match each Elizabeth to the right set of parents? ‘Our’ Elizabeth’s daughter Fortune turns up with her grandparents in 1851, which helps, as does a witness on her marriage.
Do we have to go further back on this line to find a common ancestor, or is it something less obvious? It would probably be necessary to build out family trees for all possible links to get any further, a fair bit of work.
The matches are not top level, at only 20 to 30cM per Ancestry, or mid-30s by MH/FTDNA reckoning. For quite a small village, though, too large a cluster to ignore.
And …
A complete surprise is a grouping with a common location of Newfoundland. CentiMorgan levels are similar to the Somerset cluster. In Ancestry this shows as being on the maternal side, and there is a suspicion that the Rees line in the early 19th century from Llanarthne near Carmarthen – not far from a port – could be involved. Otherwise, no idea!
… more clustering
An interesting feature available on MyHeritage, once the DNA transfer has been unlocked, is ‘AutoClusters’. This gives another angle on shared matches, bringing an algorithm of some sort into play.

Each cluster gets its own colour, and the image above shows the default way of viewing the results, clearly grouped with matched names along two sides. You do get a csv file which gives the names, cM levels and links to trees, so that you can check through the details and perhaps find something useful.
Cluster 2 (orange) is the Watts line, cluster 3 (yellow) the Newfoundland enigma, cluster 5 (blue) Seavington. Cluster 1 (red) appears to be mainly from the States, and number 4 (green) possibly Australian. (Grey squares are ‘out of cluster’ matches.) That’s about it for usefulness in this case, but it’s pretty.
Into the Chromosome
Both MyHeritage and FamilyTreeDNA come with chromosome browsers for use with their autosomal DNA offerings {1}. They are essentially quite similar although the interfaces operate differently, producing a visual representation of where the underlying DNA matches between individuals are, along with some corresponding data.
Checking the actual segments shared with others through the chromosome browser gives greater confidence in the level of match, and could help to resolve border cases in clustering, for instance.
Here are the same three matches from the Seavington cluster from the two versions. (The two identical patterns appear to be from sisters.)
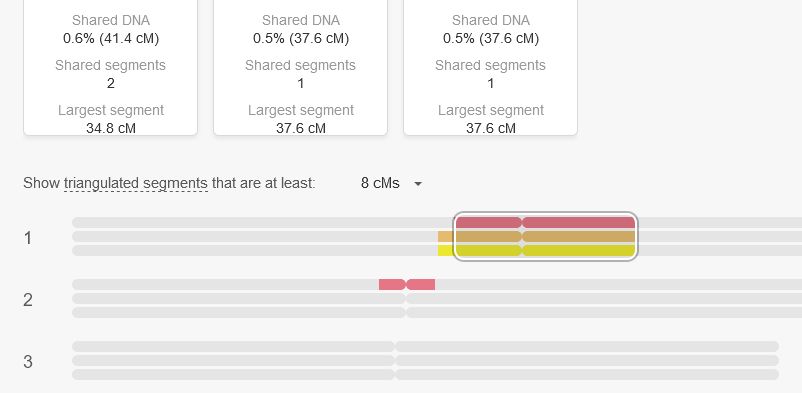

The hatched grey area in the FamilyTreeDNA image shows an “SNP poor region – not tested for Family Finder” (FamilyFinder is FTDNA’s name for autosomal). Remember, this is generated from an Ancestry DNA test data file, and each company runs their tests, and hence their analysis, a little differently. Hopefully this fact has been taken into account in the matching algorithm.
A helpful Zoom talk for Norfolk Family History Society this month was on “ten tips to get more from autosomal DNA tests”, given by Martin McDowell {5}. He pointed out that “uploaded DNA is only about 85% compatible” – losing detail and accuracy between the differing tests, although this mainly impacts the lower end of matching ranges.
Where in the world?
The earlier Cutlock DNA article is titled ‘DNA matches to place and people‘ and led off with the ‘ethnicity estimate’ offered by Ancestry. This breakdown pretty matched expectations, so it is bit of a disappointment to view the recently unlocked origins mapping from the other two firms.


As illustrated here, they give rather vaguer and differing results, partly explained by the effect of smaller databases. Most striking contrast from Ancestry is 12% of Italian blood appearing with MyHeritage, or from FamilyTreeDNA 7% Iberian/3% Italian. Producing these estimates is hardly an exact science yet, best not to take the suggested ‘communities’, let alone the supposed traits revealed through DNA, too seriously {6}.
Make contact
It would be good to hear from anyone who can help with the Seavington puzzle, perhaps others related to Scott, Vickery or Phelps lines from there. And anyone else reading who has spotted a DNA match – John Howes/HWNS skeleton tree.
Notes
- MyHeritage charges £35 to access the chromosome browser, AutoClusters tool, full info from matches, etc. For FamilyTreeDNA it’s $19 covering chromosome browser and “origins” – currently about £15 plus any currency conversion charge. North of Ireland FHS has downloadable guides on how to transfer your DNA test results.
- The Y-DNA sample was sent off to FamilyTreeDNA facilities in Texas shortly after the first Cutlock DNA article ‘DNA matches to place and people‘ appeared, and results at 37 marker level appeared online in mid-February. These were along expected lines with a probable Besthorpe origin for our Howes family, but to try to nail things down further the test is being upgraded to 111 markers. Watch out for a full report in due course.
- There are large number of matches in the lower ranges which aren’t generally worth spending much time on. With luck, Ancestry’s ThruLines feature picks up any of value.
- Some statistics:
- Ancestry top match – 281 centiMorgans (cM) total shared DNA with longest segment of 84cM; top ‘unknown’ match coming in at 178cM total shared/45cM longest (a possible Watts second cousin); plus three other unidentified matches recording greater than 100cM shared.
- MyHeritage – highest shared 358cM, longest block 94cM; two unidentified having above 80cM shared.
- FamilyTreeDNA – highest shared 60 cM, longest segment 37cM.
- Martin McDowell appears to be doing a number of such talks for local FHS, such as ‘Genetic genealogy for beginners’ online for Dorset 19th March. Catch one if you can. He is involved with North of Ireland FHS.
- See ‘How can DNA tests determine ethnicity?‘ article on Who Do You Think You Are? magazine’s website for more on this subject. As it says, the estimates aren’t really about ethnicity, rather ‘biogeographical ancestry’.
Have something to add?